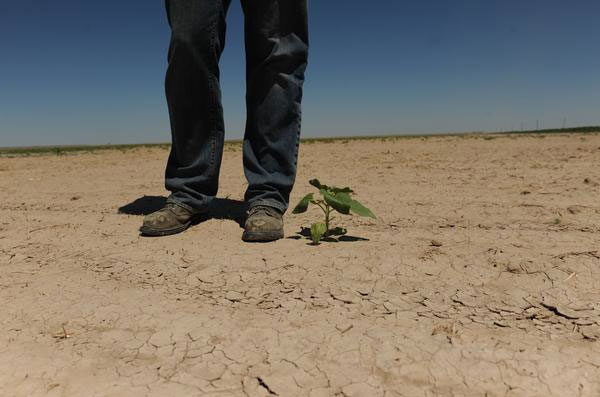
A more specific drought-measuring formula created by a group of Vanderbilt University environmental engineers could have implications for emergency planning, federal relief payouts and drought mitigation efforts.
With California’s record drought sending the state and farmers to the bargaining table over water, officials there and in other drought-stricken states are calling for more specific city- and county-level data.
Graduate student Leslie Lyons Duncan, Vanderbilt Institute for Energy and Environment (VIEE), former graduate students Debra Perrone and John H. Jacobi and VIEE director George Hornberger published a paper about their new drought index calculator in the latest edition of the journal Environmental Science and Technology.

Duncan frequently used the Palmer drought indices while studying 1,200 years of Pacific Northwest drought patterns and their correspondence with solar cycles. The indices measure drought based on precipitation, temperature and the water-holding capacity of soil.
The National Oceanic and Atmospheric Administration catalogs historic Palmer Drought Severity Index data, but it’s on the relatively large climate division scale – meaning, for example, that the Tennessee cities of Nashville, Shelbyville and Clarksville are in the same division, even though their weather can vary significantly.
Duncan and her colleagues created an interface where users can plug in the data that the Palmer indexes use and calculate their own readings specific to a much smaller area.
“That coarse level of information is used by researchers and policy makers,” Duncan said. “Our thought was, ‘Is there a smaller resolution at which you pick up more of the variation?’ But if you work with too small of a resolution, there’s too much differentiation when you’re a decision maker. So we chose to use half a degree by half a degree latitude and longitude, or about 50 square miles.
“The picture of drought can look very different when you’re not looking at a huge section of the state at once.”
Decision makers can use the tool the Vanderbilt team created to calculate their own drought indices for cities and counties. The team located water, temperature and soil data for the smaller areas nationwide and, when they applied their calculations to the Pacific Northwest, found significant differences between the monthly climate division value for drought and their own grid-box value in the majority of instances.
The same calculations can be used in the university’s work with drought-stricken farmers in Sri Lanka, said Hornberger, who is also University Distinguished Professor of Civil and Environmental Engineering and Earth and Environmental Science and holds the Craig E. Philip Chair in Engineering.
“My take is that the people who have been exclaiming that they need a tool to get better resolution — this could be an important thing for them,” Hornberger said. “We’ve made it freely available, and we’re more than happy to share.”
He said officials can use the tool to put in water restrictions for certain areas based on the Palmer index specific to those areas, using the tool to check week after week.
Perrone is a post-doctoral fellow at Stanford, and Jacobi is a risk analyst with Aon Benfield. Duncan is preparing to defend her dissertation. Their work was funded by the Department of Energy through the Consortium for Risk Evaluation with Stakeholder Participation, the Environmental Protection Agency and the National Science Foundation.
To receive a copy of the calculator, email Jacobi at john.h.jacobi@vanderbilt.edu.
Contact
Heidi Hall, (615) 322-6614
heidi.hall@vanderbilt.edu
On Twitter @VUEngineering